|
Size: 6558
Comment:
|
Size: 6598
Comment:
|
| Deletions are marked like this. | Additions are marked like this. |
| Line 14: | Line 14: |
| P is the number of projections, A is the angular step in degrees and S is the symmetry number (number of asymmetric units, eg 60 for icos, 14 for D7, etc.) |
P is the number of projections, A is the angular step in degrees and S is the symmetry number (number of asymmetric units, eg 60 for icos, 14 for D7, etc.) |
| Line 35: | Line 35: |
| '''figure''' | {{attachment:coverage15.png}} |
| Line 39: | Line 39: |
| '''figure''' | {{attachment:fullatnyquist.png}} |
Angular sampling, number of projections and resolution
Historically in EMAN, you needed to specify a value for 'ang=', the angular spacing of the projections used to classify the particles. In EMAN2.1 this is normally computed for you, but a general discussion of the principles involved can still be useful, as this is the basis for how EMAN2.1 decides what to use. In essence these are very simple geometrical arguments, but in practice you will need to understand Fourier transforms pretty well to be able to fully follow the arguments on this page. Even if you don't fully follow, the practical advice can still be followed.
If you hope to achieve resolution X, how fine an angular sampling do you need to have, or, to put it a different way, how many different particle orientations do you need ? To an extent, the answer to this question depends on your situation. The classic answer to this question, dating back to the 60s (?) is pi*D/d, where D is the object size and d is the targeted resolution. However this gives the value for tomographic sampling, ie - only looking at particle orientations evenly spread around the equator of the specimen. In single particle analysis, we (hopefully) have particles in completely random orientations on the grid. While in practice there will often be a preferred orientation, which may lead to anisotropic resolution in the final structure, the sampling required to achieve a given resolution is still the same.
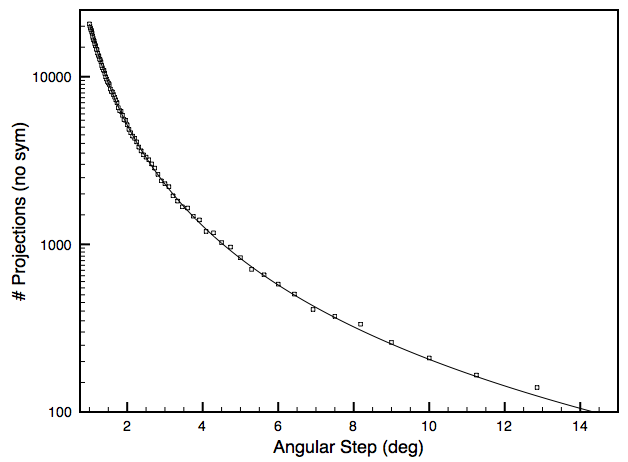
Let's begin by considering the number of projections produced on the unit sphere as a function of the angular step between projections. This will vary slightly with different algorithms used to spread the points as equally as possible on the sphere, but for the default EMAN algorithm, it looks like this:

As you can see, even on a log scale, this curve falls rapidly with angular step. The relationship is actually fairly simple, however, and
P = 20602/(A^2 * S) gives a very close approximation, where
  P is the number of projections,
  A is the angular step in degrees and
  S is the symmetry number (number of asymmetric units, eg 60 for icos, 14 for D7, etc.)
Due to the squared relationship you can see that going from a 2 degree angular step to a 1 degree angular step will make refinements take 4x longer to run, and will produce class averages with 1/4 as many particles. But how many projections are really necessary ?
This question is easiest to address in Fourier space. The projection theorem tells us that any projection image of a 3-D structure is simply a 2-D slice through the origin of the Fourier transform of the 3-D structure. That is, one can quickly compute projections of a map (with some nasty artifacts, unfortunately) by computing the FFT of a 3-D structure, extracting a 2-D slice, then computing the IFT of the slice. Conversely, when reconstructing a 3-D map, the FFT of all of the particles or class-averages can be computed, then inserted into an empty volume in Fourier space, each in the correct orientation. In practice, this process is a bit tricky and requires interpolation from a 2-D grid to a 3-D grid, which produces artifacts, and so on, however, the basic concept holds. Now, in Fourier space, radius corresponds to resolution. Higher radii correspond to finer levels of detail in the real-space 3-D structure. If you picture inserting slices in various orientations, it should be clear that as you get to higher and higher radii, the slices will cover less and less of the unit sphere. To truly achieve resolution X, we need to have complete coverage of this sphere with some level of sampling. The amount of sampling is determined by three factors:
- the box-size of our particle (in pixels)
- the radius in Fourier space of our targeted resolution
- How interpolation is performed in Fourier space (the so-called interpolation kernel)
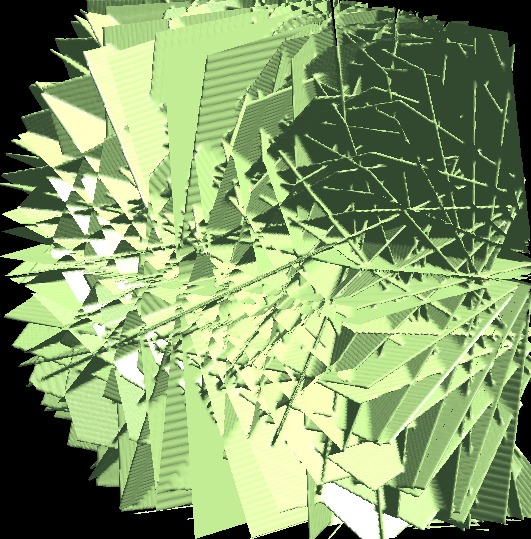
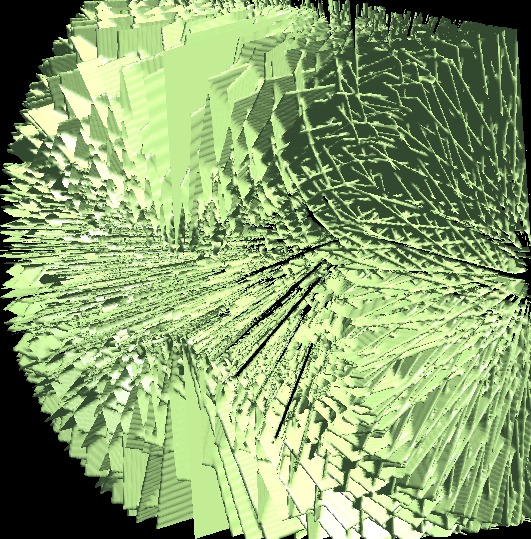
These two images show how Fourier space is filled by slices (box size of 512x512x512):
|
|
Clearly the finer sampling produces better filling in Fourier space, but at 7.5 degrees with this box size, filling is far from complete near the edge of the box.
What we need to compute, then, is the 'coverage' value for different situations. That is, what fraction of the shell is completely filled by the given slices at a given radius (resolution). We can forget the actual resolution for a moment, and simply consider the geometrical problem of inserting slices with a 2-voxel wide interpolation function into a box at different N-voxel radii.
Extremely Conservative Approximation
Let's begin with an extremely conservative estimate of the number of projections we need. In this estimate, we required that Fourier space be 99.5% filled with at least 1.5 samples in every voxel at Nyquist frequency (the highest conceivable resolution for a given box size). While we could come up with some theoretical estimates for these values, the actual numbers will depend quite strongly on the specific algorithm used for slice insertion, so we take the experimentalist's approach and simply compute the coverage at Nyquist for different box sizes as a function of the number of uniformly distributed projections, requiring that each voxel have a summed weight of at least 1.5. This means we only consider a voxel to be 'covered' if its value has been contributed to by at least 2 pixels in the projection images. Doing this little computational experiment gives the following:
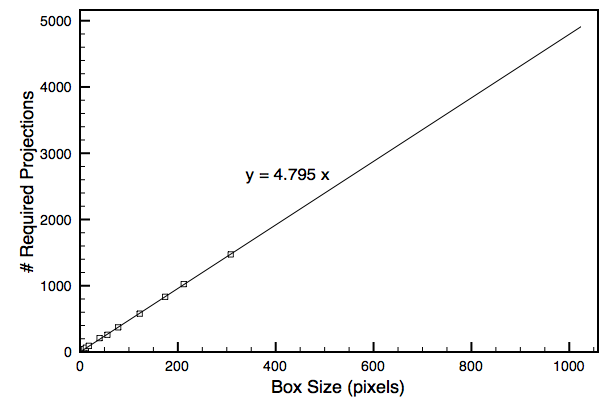
Each of these curves represents a different number of projections, and shows the %coverage as a function of box-size. As you can see, due to thresholding and other effects, these curves are highly nonlinear. Using our selected threshold value of 99.5% coverage, we can then compute the sampling required to achieve full sampling at Nyquist, and plot that:

This represents an extremely conservative estimate for the number of projections you need to generate for each box size. There should really never be any reason to use finer sampling than the numbers presented here in any practical reconstruction problem.
More Reasonable Approximation
Overestimating the number of projections required for a reconstruction can lead to massive waste in both human and computer time, as well as, in some cases, produce lower quality structures than could be achieved with more reasonable values. The values above


